I applied for a post-doc position with the SECO project recently. I got the job, so I thought I would post the presentation I gave as part of the interview. The idea for the presentation was to give a 12 minute run-down of “my previous work, how it links to the post-doc position, and my plans for the position”. I’ve pasted the slides below with an approximate script of what I said.

I’ll tell you about my previous work and how it links to SECO, give you an idea of my general research interests, and tell you some of the ideas I have for this post-doc and what interests me about the science of the project.
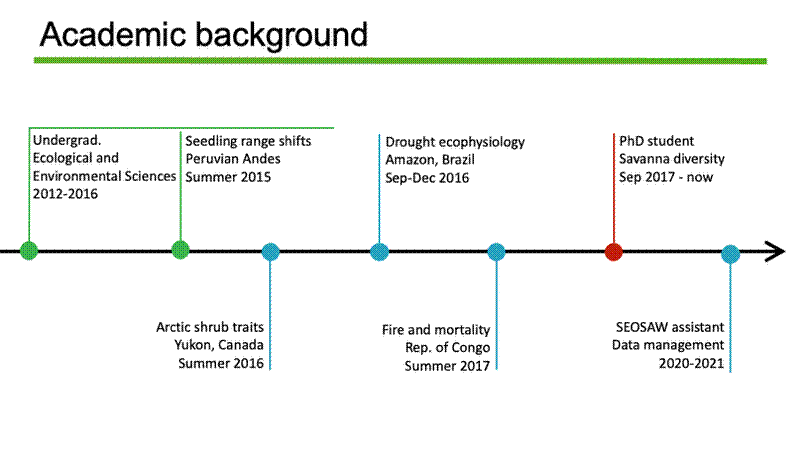
Before I dive into my PhD research, I wanted to highlight some other projects I’ve been involved in which I think provided me with valuable experience that I can apply to this post-doc.
For my undergraduate dissertation I studied tree seedlings in the Andes and climate induced range shifts. I used leaf functional traits and physiological stress responses to predict the elevational limits of different species.
In Canada I worked as a field assistant, on a project studying the effects of climate warming on the functional traits of shrubs. We used pheno-cams to monitor phenology, to make predictions about changes in vegetation structure.
I worked with Lucy Rowland from University of Exeter as a research assistant on a drought experiment in the Brazilian Amazon, where we looked at hydraulic traits and leaf gas exchange to investigate the effect of drought on tree mortality.
In 2017 I managed the fieldwork for a fire experiment in the Republic of Congo, where I supervised a local field team for 5 weeks, doing mortality surveys and plot burning.
Now I’m getting towards the end of my PhD, which I hope to hand in before the end of August 2021.
Next I’ll cover the skills and insights from my PhD that I think will be useful for the post-doc.

My PhD is on how tree species composition and diversity affects woody biomass and ecosystem structure in southern African savannas.
My thesis uses a combination of original field data, plot census data from SEOSAW, and various remote sensing data.
One of the key parts of the thesis was a large data synthesis model using 1200 woodland plots in a structural equation modelling framework to determine how environmental context affects the relationship between species diversity and biomass.
Then I conducted two studies looking at specific ecological mechanisms that might drive diversity-productivity relationships in savannas. The first used plot data and MODIS data to investigate the effect of species composition on pre-rain green-up and senescence in Zambia. The second used terrestrial LiDAR data to investigate how spatial diversity metrics affect canopy structure and foliage density.
Also, as part of the PhD I set up 15 permanent plots in Bicuar National Park in Angola with in-country colleagues. We wrote a paper together on the floristic diversity of the park in relation to other miombo formations.
I think my PhD project reflects my interest in how community assembly drives biomass dynamics in different environmental contexts, and also reflects my interests in both macro-ecology style modelling and plot-based field studies.

Last year, I took a break from PhD to manage the SEOSAW database for 5 months.
The original plan was to manage the establishment of new permanent plots in under-studied areas, but COVID meant we had to change plans and I took on more of a database manager role.
I spent a lot of time formalising the cleaning process for the database, to make it more reproducible, including an overhaul of the species name checking system.
I also incorporated new datasets from various SEOSAW partners and supported them in data processing and data collection.
I wrote documentation and created digital data collection forms for colleagues, both as a capacity building tool and to ensure data quality, and I drafted a mortality recording system that is more suited to the dry tropics where trees resprout.
I think this experience especially puts me in a really good position to critically analyse plot data we might get in SECO.

Now I’ll switch to talking about SECO itself.
We know that variability in the dry tropical carbon sink is a major source of uncertainty in the global carbon cycle. There are various drivers of change pushing dry tropical vegetation in opposing directions. Importantly, it’s been suggested that atmospheric CO2 enrichment will increase woody biomass, particularly in savannas, by reversing the competitive balance between C4 grasses and C3 trees. But there are also expected to be concurrent changes in rainfall seasonality, temperature and fire regime.
It’s important to consider that there are many functionally distinct vegetation formations within the dry tropics, even in similar environmental contexts. Across each continent, dry tropical vegetation formations are more related to their moist forest neighbours than to dry tropical formations on other continents. Meaning these vegetation types are likely respond differently to drivers of vegetation change based on their adaptive potential.
An interesting avenue for us to explore I think will be using growth and mortality data from the SECO plots, combined with functional trait data of species within the plots and their phylogenetic relationships, to identify the bioclimatic envelopes of these different vegetation types, and to use that demographic and functional information to predict which drivers of change are likely to have the greatest effect on biomass in different regions.
Of particular interest to me is whether the functional diversity of the species pool will constrain the ability of different vegetation formations to succeed following environmental change. We might expect for instance that the comparatively species rich dry forests and savannas of the neotropics might contain enough functional redundancy so that when the climate changes they can maintain productivity, albeit with differences in species composition, while in the species poor savannas of southern Africa, climate change may severely reduce productivity as fewer species can fill the niche space.
As an aside, the map on this slide was my attempt to re-create the map of the SECO working region which I found on the SECO website. I think just defining the working region of the dry tropics will prove to be an interesting challenge. Doing this exercise really highlighted to me that India and southeast Asia will be particularly controversial, due to their very different structure to the rest of the tropics. Maybe we can help to find unifying conditions for the dry tropics during SECO.
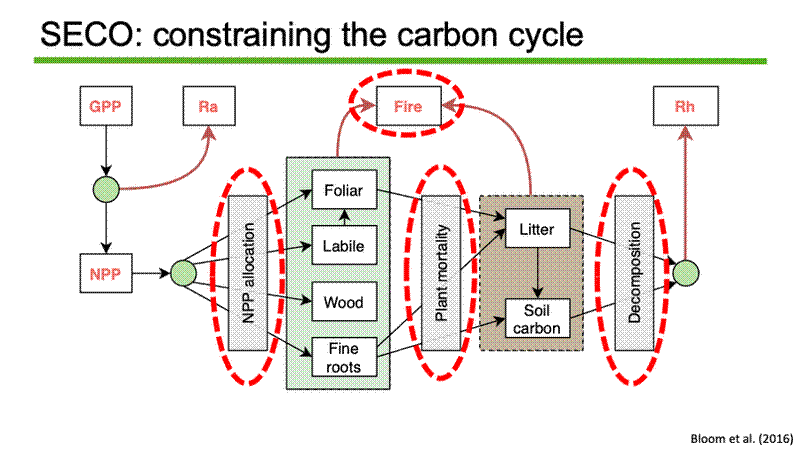
We know that one of the key goals of SECO is to constrain important sources of variation in the carbon cycle of the dry tropics. In this next section I’ll talk about specific biological mechanisms that I think will be important in driving variation in carbon cycling, and how the SECO plot data can improve our understanding of those processes.
This flow chart should be familiar to the panel, it’s the DALEC carbon cycle model, which I imagine will play some part in the modelling aspect of SECO. I thought the model would be a good way to structure my thinking on what biological mechanisms affect variation in the carbon cycle across the dry tropics. I’ve marked some key processes in the model which are likely to drive variability in the carbon cycle across the dry tropics, and I’ll discuss how our understanding of each could be improved through analysis of the SECO plot data.
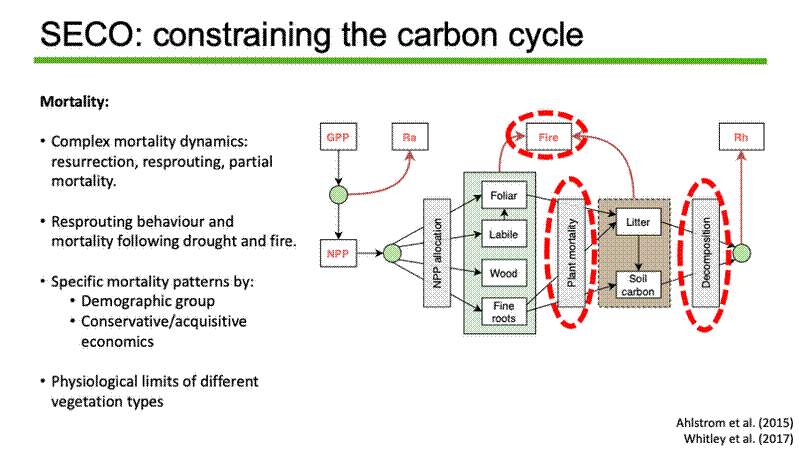
First: Mortality.
Trees in the dry tropics have incredibly complex mortality dynamics. They resurrect, resprout, and lose parts of the plant to different extents depending on species, environmental pressures, and disturbances. We need mortality protocols that are tailored to the dry tropics and which consider these complex dynamics, otherwise we could misrepresent the mortality signal.
Particularly I think we should investigate further how fire and drought affect resprouting behaviour and mortality, because both these environmental pressures are expected to vary a lot in the future.
We should look at how this varies among vegetation types, among species across the conservative/acquisitive trait spectrum, and among different demographic groups so we can make predictions about how future vegetation composition will look.
To understand how different vegetation types are expected to fare under climate change, we need to understand how close their constituent species are to their physiological limits. We can assess this using mortality and growth, or even using direct ecophysiological methods for a subset of plots.
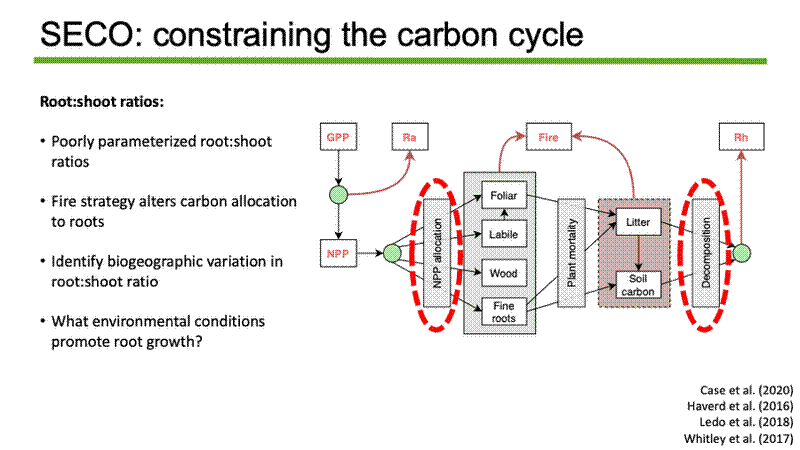
Next: Root:shoot ratios
Allocation to different carbon components varies according to environment and species life history strategy. Variation in carbon allocation has knock on effects for decomposition and carbon residence times as different carbon components turn over at different rates.
Allocation to wood and roots is normally modelled in large carbon cycling models as a constant root:shoot ratio. But that ratio is often poorly parameterised, especially in the dry tropics, and doesn’t account for continental variation in adaptive traits and evolutionary history that means species allocate differently under similar environmental forcings.
For example, Australian and African savanna tree species differ in fire avoidance strategy. Australian Eucalypts grow tall and thin, while African species more readily invest in root structures, meaning these two savanna types are likely to vary in how they allocate to above- and below-ground structures under a changing environment.
We need to do more to identify environmental and biogeographic conditions that lead to variation in the root:shoot ratio across the dry tropics, because without understanding roots we might majorly misrepresent carbon storage.
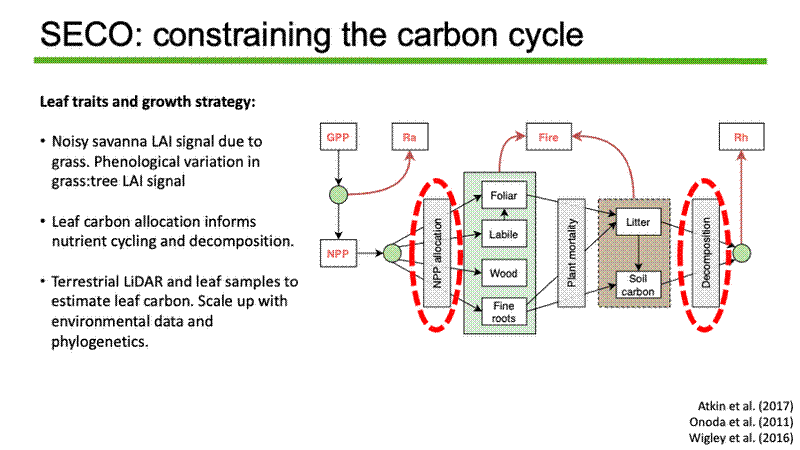
Thirdly: leaf traits
Leaf traits and leaf carbon allocation can tell us about productivity in a system, being the organ chiefly responsible for photosynthesis. In savannas it can also tell us about competitive relationships with grasses, and also links to decomposition and phenology in deciduous systems.
In carbon cycling models leaf carbon allocation most often estimated using remote-sensing products like Copernicus Leaf Area Index, but the coexistence of grass and trees in savannas means the signal is often noisy, and this is complicated even more by seasonal variation in the relative grass:tree contribution.
We could use terrestrial LiDAR coupled with leaf trait measurements that represent the leaf economic spectrum to precisely estimate leaf carbon at selected sites. Then set that in the context of environmental factors and other aspects of plant physiognomy to make predictions about the effects of climate change on leaf production in different functional groups of trees. Then we can pair these on-the-ground measurements with satellite data, and phylogenetics to scale up across whole biomes.
Basically there are trade-offs in the leaf and root economic spectrum which determine allocation to different carbon components have knock on effects for mortality and decomposition with consequences for the entire carbon cycle.
To summarise this presentation, I think my combination of skills, which I’ve developed in the dry tropics, and which all contribute to my in depth understanding of carbon dynamics and biogeography as it applies to this biome, set me up really well to make a decent contribution to the SECO project.
I hope you can see that I have lots of ideas about this project, even though I’ve only had the time to cover a few of them. I think there are loads of avenues for us to produce research which not only answers the 4 key questions posed by SECO, but also answers some intermediate and more mechanistic questions which could shed light on how the dry tropics operate, both floristically and functionally.
