I have grand plans to establish a repeat survey of the trees in the New Wood which was planted in April 2021. I want to get a better idea of which species are doing well, the mortality rate, and maybe eventually see if there are any spatial patterns in competition among individuals. I did the first survey in September 2021, but only just finished entering the data, as it fell to the bottom of my todo list. I’d like to do another survey in September this year. Last year I think it took about 5 hours to do the whole survey, but I split it over a few days. If I make sure I’m prepared this time I reckon I can do it in a day. I’ve created an ODK form to cut down on the time spent transcribing data from notebook to computer.

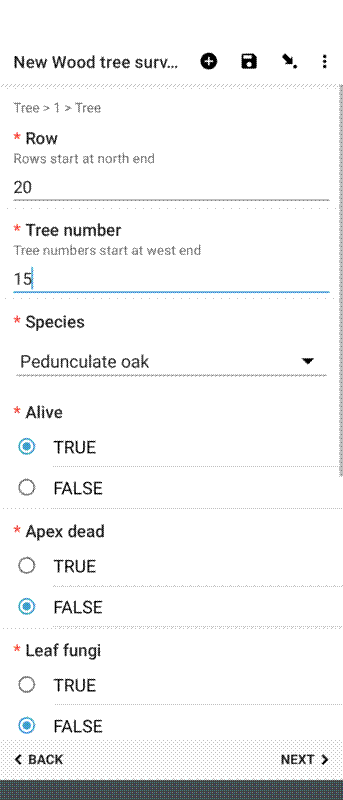
In the first survey I recorded:
- Row and tree number
- Species
- Alive or dead
- Whether the apex is dead
- Whether the tree has fungi on the leaves
- The type of tree guard
- Whether the tree has been mulched since the last census
- Any other notes on condition
As the trees get older I’m hoping I can also measure their height, but I didn’t get round to that in the first year.
Although there’s about 5000 trees in the New Wood, I only have time to survey the short-rotation coppice area, which is 1070 trees.
There’s 10 different species in the coppice area:
- Corylus avellana (hazel) - 420
- Betula pendula (silver birch) - 297
- Quercus robur (pedunculate oak) - 170
- Ilex aquifolium (holly) - 82
- Indet indet (unknown) - 31
- Carpinus betulus (hornbeam) - 18
- Prunus avium (wild cherry) - 18
- Prunus spinosa (blackthorn) - 17
- Crataegus monogyna (hawthorn) - 11
- Frangula alnus (alder buckthorn) - 5
- Viburnum opulus (guelder rose) - 1
Only 14 of the trees had been mulched back in September 2021, but I know now that it’s much more.
Most of the hazel, blackthorn and hawthorn are in spiral guards, and it looks like the few hornbeams that were planted in this block were also mistakenly planted in spiral guards. All of the holly except one were planted in the wider diameter holly guards, which makes sense because they’re easy to identify.
| Species | Spiral | Holly | Small | Medium | Large |
|---|---|---|---|---|---|
| Betula pendula | 4 | 0 | 74 | 139 | 80 |
| Carpinus betulus | 10 | 0 | 2 | 3 | 3 |
| Corylus avellana | 416 | 0 | 3 | 1 | 0 |
| Crataegus monogyna | 11 | 0 | 0 | 0 | 0 |
| Frangula alnus | 3 | 1 | 0 | 0 | 1 |
| Ilex aquifolium | 0 | 81 | 0 | 0 | 1 |
| Indet indet | 7 | 0 | 5 | 9 | 10 |
| Prunus avium | 0 | 0 | 4 | 8 | 6 |
| Prunus spinosa | 14 | 0 | 1 | 2 | 0 |
| Quercus robur | 7 | 0 | 44 | 68 | 51 |
| Viburnum opulus | 1 | 0 | 0 | 0 | 0 |
If you don’t include the individuals that I couldn’t identify, mostly because they were just sticks with no leaves, pedunculate oak seems to have experienced the most mortality.
| Species | Dead | Alive |
|---|---|---|
| Betula pendula | 1 | 296 |
| Carpinus betulus | 0 | 18 |
| Corylus avellana | 8 | 412 |
| Crataegus monogyna | 0 | 11 |
| Frangula alnus | 0 | 5 |
| Ilex aquifolium | 1 | 81 |
| Indet indet | 29 | 2 |
| Prunus avium | 0 | 18 |
| Prunus spinosa | 1 | 16 |
| Quercus robur | 12 | 158 |
| Viburnum opulus | 0 | 1 |
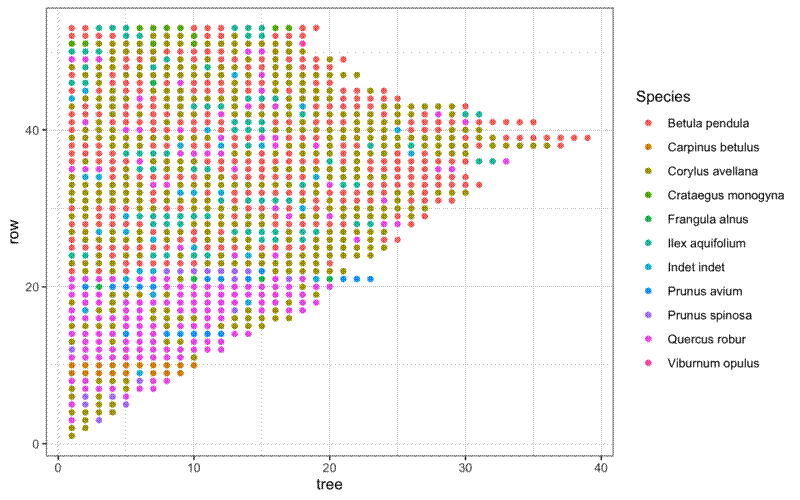
I haven’t got around to making a proper stem map, but the trees are all approximately 2.5 m apart, and the rows are roughly perpendicular to a fence line that runs along the eastern edge of the planting area, so it’s possible to make an approximate map just using the rows and tree numbers.
This is the species layout, which shows a lot of pedunculate oak at the bottom of the planting area, and lots of hazel at the top end. There’s a couple of rows with lots of hornbeam in the 9th and 10th rows from the bottom.
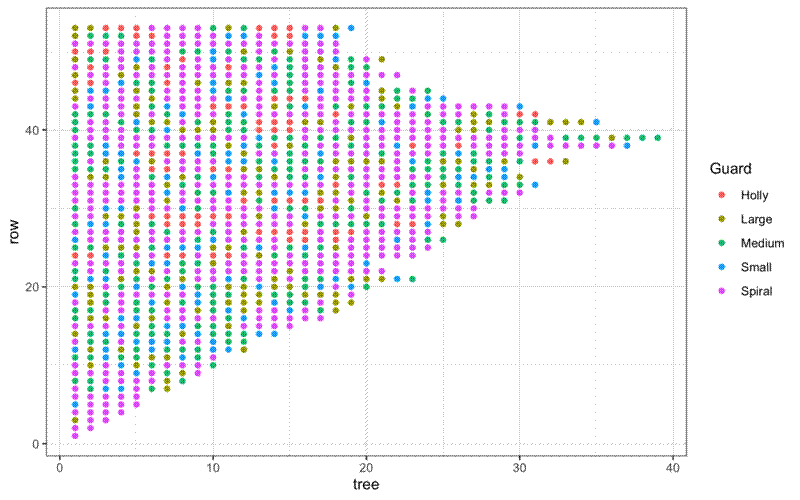
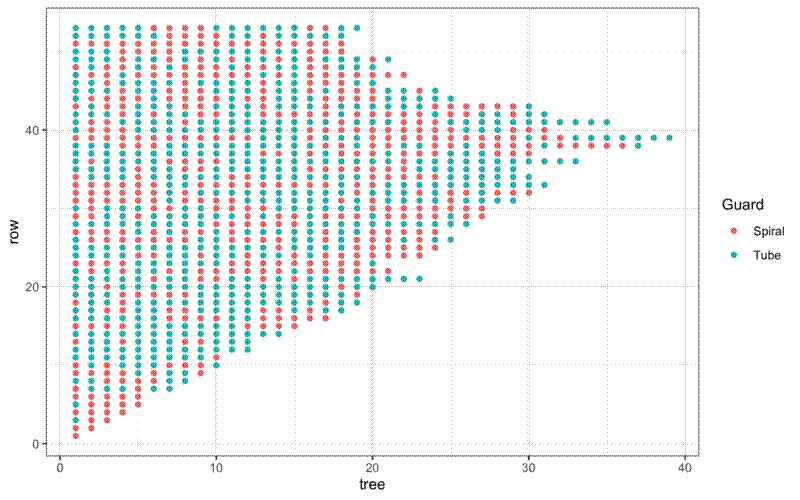
Thee doesn’t seem to be much of a pattern in the type of guards used in different areas of the planting area.
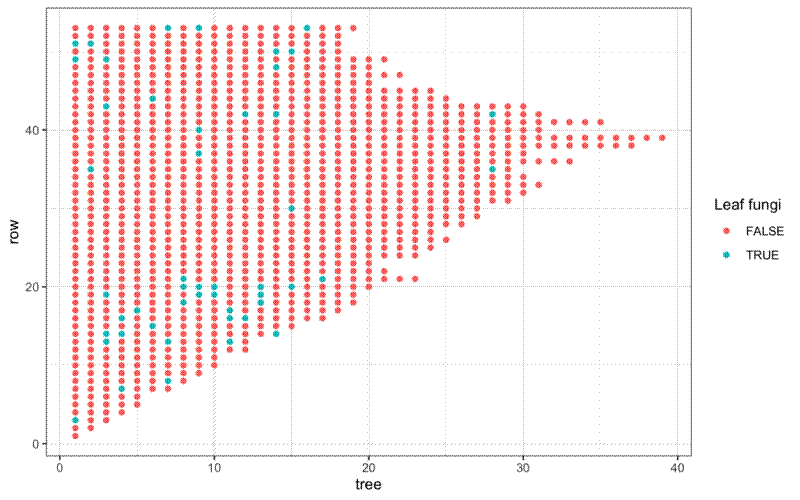
Maybe there’s a bit of clustering of trees afflicted by leaf fungi, with more trees to the bottom of the planting area, but that could also just be because most of the trees with leaf fungi were oak, and they are concentrated at the bottom of the planting area.
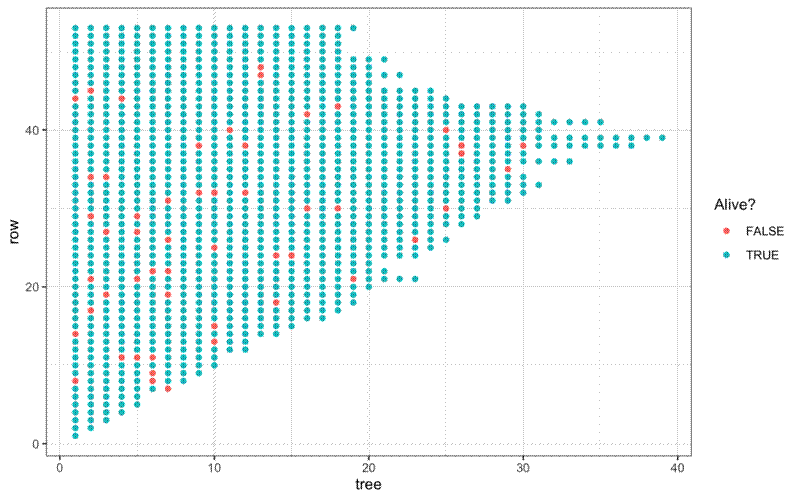
Finally, there doesn’t seem to be any spatial pattern of tree mortality, which is good to see.
